September Runoff Below Average for Missouri River
September runoff in the upper Missouri River Basin was below average, continuing the trend of below-average runoff in 2026.
“Although precipitation was wetter-than-normal in September for large areas of the lower basin, portions of the upper basin were dry and warm, causing the September runoff in in the upper basin to be below average,” said John Remus, chief of the U.S. Army Corps of Engineers’ Missouri River Basin Water Management Division.
“Runoff into the Fort Randall and Gavins Point reaches of the Missouri River, however, were well above normal. Precipitation downstream of Gavins Point Dam increased tributary flows and allowed Gavins Point releases to be reduced, while maintaining navigation flow support downstream,” Remus added.
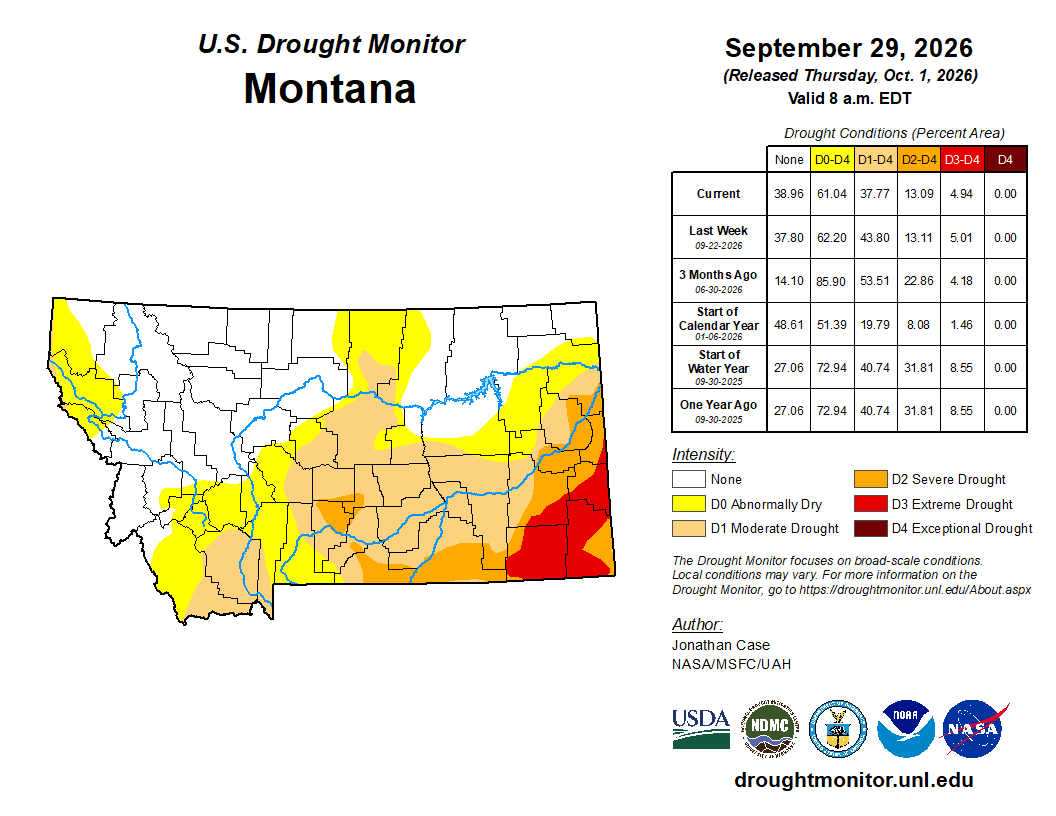
September runoff was 1.0 million acre-feet (MAF), 82% of average for the basin above Sioux City, 0.5 MAF more than forecast. September precipitation was 200 to 400% of normal over large areas of the basin except in Wyoming and northern Colorado. According to the Sept. 30 drought monitor, approximately 72% of the Basin is still experiencing abnormally dry or drought conditions. Drought conditions are expected to persist or expand in Montana, northwestern Wyoming, western North Dakota, and western South Dakota through December, but improve over the rest of the basin.
The 2026 calendar year runoff forecast for the Missouri River Basin above Sioux City, Iowa is 16.3 MAF, 63% of average and 0.9 MAF more than last month’s forecast. If realized, this forecast would be the 14th lowest runoff in the period of record.
As of Oct. 1, the total volume of water stored in the System was 46.1 MAF, which is 10 MAF below the base of the System’s flood control zone. System storage is forecasted to continue declining through the fall. The updated reservoir studies indicate that the System storage is expected to be 44.7 MAF at the start of the 2027 runoff season, approximately 11.4 MAF below the base of flood control.
Reservoir Forecasts
-
Fort Peck Dam
- Average releases past month – 6,900 cfs
- Current release rate – 7,000 cfs
- Forecast average release rate – 7,000 cfs
- End-of-September reservoir level – 2222.2 feet (down 0.8 feet since August 31)
- Forecast end-of-October reservoir level – 2221.2 feet
The forecast reservoir releases and elevations discussed above are not definitive. Additional precipitation, lack of precipitation or other circumstances could cause adjustments to the reservoir release rates.
Hydropower:
The six mainstem power plants generated 676 million kWh of electricity in September. Typical energy generation for September is 896 million kWh. The power plants are projected to generate 7.0 billion kWh of electricity this year, compared to the long-term average of 9.3 billion kWh.
To view the detailed three-week release forecast for the mainstem dams, go to: https://go.mil/mr-3wk-fcast.
MISSOURI RIVER MAINSTEM RESERVOIR DATA |
|||||
|
|
Pool Elevation |
Water in Storage |
|||
|
On September 30 |
Change in September |
On September 30 |
% of 1967-2025 Average |
Change in September |
|
|
Fort Peck |
2222.2 |
-0.8 |
12,475 |
85 |
-138 |
|
Garrison |
1824.3 |
-0.9 |
14,030 |
77 |
-258 |
|
Oahe |
1592.0 |
-1.7 |
14,300 |
82 |
-487 |
|
Big Bend |
1421.0 |
+0.3 |
1,690 |
100 |
+16 |
|
Fort Randall |
1353.2 |
-2.4 |
3,250 |
97 |
-174 |
|
Gavins Point |
1207.6 |
+1.1 |
366 |
89 |
+27 |
|
|
|
Total |
46,111 |
83 |
-1,014 |
WATER RELEASES AND ENERGY GENERATION FOR AUGUST |
|||
|
Average Release in |
Releases in |
Generation in |
|
|
Fort Peck |
6.9 |
408 |
63 |
|
Garrison |
14.9 |
884 |
127 |
|
Oahe |
22.5 |
1,339 |
184 |
|
Big Bend |
22.3 |
1,324 |
71 |
|
Fort Randall |
25.0 |
1,485 |
157 |
|
Gavins Point |
27.0 |
1,606 |
74 |
|
|
Total |
676 |
|